Project Overview
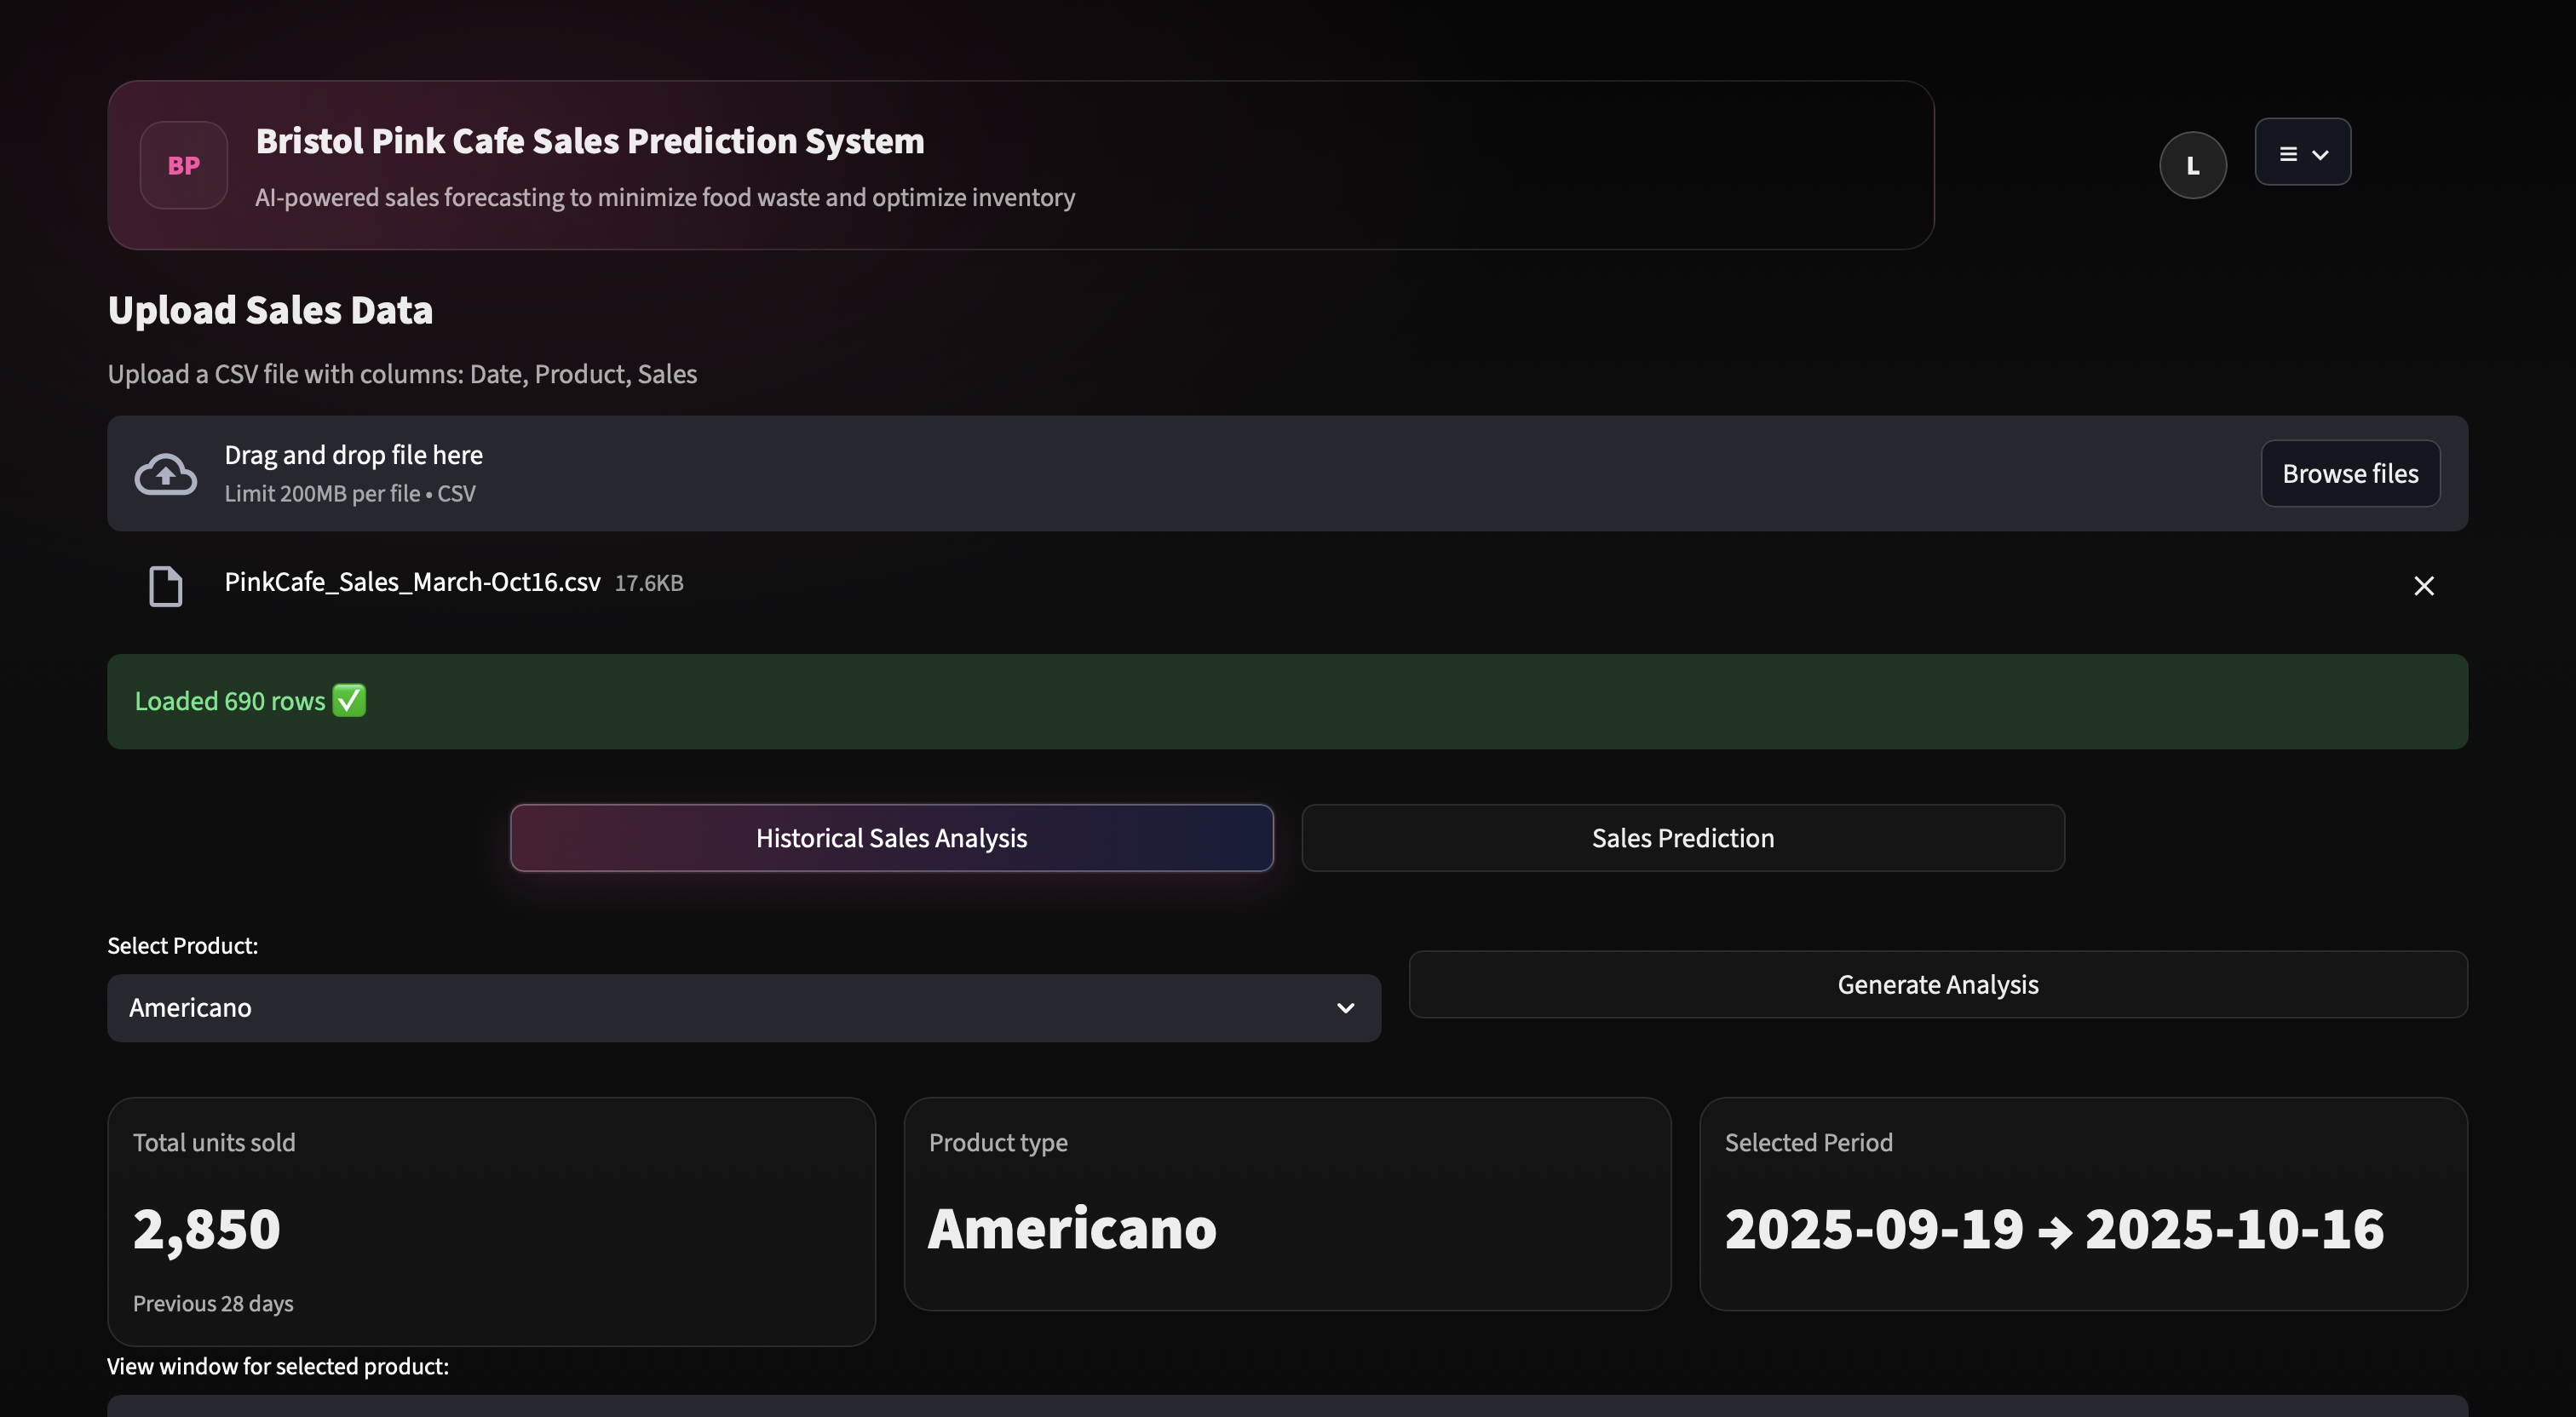
The AI-powered Bristol PinkCafe Dashboard was developed as a group project to help analyse cafe sales data and forecast future product demand. Users can upload CSV sales data, select a product, review historical performance, and generate a 28-day forecast using configurable training windows.
The dashboard combines analytics, forecasting, interaction design, and project coordination into one usable Streamlit application for sales insight and decision support.
My Role
- Main developer for dashboard implementation and feature integration.
- System designer for the dashboard structure, user flow, and visual planning.
- Project manager coordinating tasks, workflow, and team progress across the group project.
Historical Analysis
Product-level sales analysis with KPI cards, date windows, daily trend charts, and interactive Plotly visualizations.
Forecasting
Prophet-based 4-week sales prediction with configurable 4-8 week training windows and evaluation metrics such as MAE, RMSE, and MAPE.
Compare Mode
Compare two training periods for the same product, view forecast differences, and export comparison results as CSV.
Key Features
- Login/signup flow backed by a local user database.
- CSV upload for sales data with standard columns such as Date, Product, and Sales or Number Sold.
- Single-window and compare-window forecasting modes with downloadable forecast outputs.